- The daily chart portrays that the GBP/USD is still upward biased.
- Short term, the GBP/USD breaking a downslope trendline paved the way for further upside.
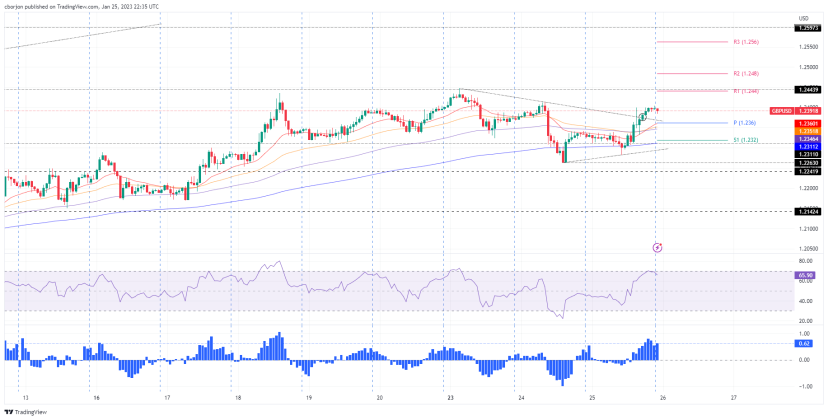
- GBP/USD Price Analysis: Intraday speaking, a test of 1.2400 is on the cards, followed by 1.2440.
The GBP/USD is trading almost flat as the Asian Pacific session begins. On Wednesday, the GBP/USD closed on a higher note, up by a half percent (0.50%), but fell short of achieving a daily close at 1.2400. Nevertheless, the uptrend remains intact, and the GBP/USD exchanges hands at 1.2392, registering minimal losses of 0.04%.
GBP/USD Price Analysis: Technical outlook
From a daily chart perspective, the GBP/USD remains upward biased, with sellers failing to drag prices below the 20-day Exponential Moving Average (EMA) at 1.2254. To further extend its uptrend, GBP/USD bulls need to reclaim 1.2443, which would exacerbate a rally towards June’s high of 1.2597, shy of the 1.2600 figure.
Intraday speaking, the GBP/USD is neutral to upward biased. After breaking above a downslope resistance trendline drawn from January 23 highs, broken around 1.2370/75, opened the door to challenge the 1.2400 mark. Nonetheless, the Relative Strength Index (RSI) slope is aiming downward, which suggests that a pullback to the daily pivot point level at 1.2363 is on the cards. Following that, the GBP/USD might print a leg up towards 1.2400, followed by the R1 daily pivot at 1.2440, followed by the R2 pivot at 1.2483.
GBP/USD Key Technical Levels