- Gold buyers struggle around multi-month high, snaps three-day uptrend, but stays comfortable beyond $1,920 support confluence.
- Pre-data anxiety joins fading hawkish bias on Fed to probe XAU/USD bulls.
- Firmer prints of US Q4 GDP, Core PCE could renew bullish bets on FOMC and extend latest pullback.
Gold price (XAU/USD) retreats from a nine-month high as bulls await the key US data/events for further directions while aiming for the fresh multi-month peak surrounding the mid-$1,900s. In addition to the cautious mood ahead of the key US growth and inflation data, a light calendar and contrasting plays between the Federal Reserve (Fed) and the European Central Bank (ECB) officials also seem to weigh on the Gold price of late.
That said, holidays in China and Fed’s blackout join the ECB’s one-week silence period starting from Thursday to restrict immediate XAU/USD moves.
Also read: Gold Price Forecast: XAU/USD bulls approach $1,967 ahead of United States Gross Domestic Product
Gold Price: Key levels to watch
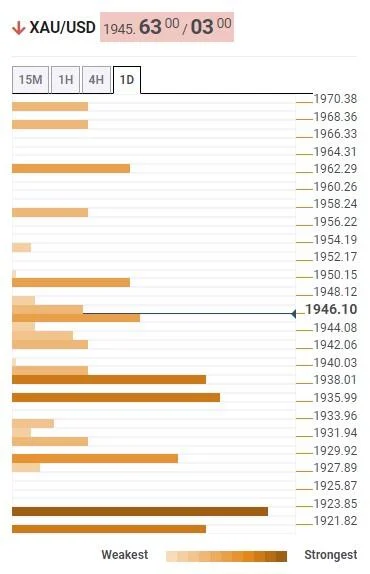
The Technical Confluence Detector shows that the Gold price grinds higher past the $1,920 support confluence including the previous lows on one-day and one-week.
Also putting floor under the Gold price could be the convergence of Fibonacci 38.2% on one-week, 200-Hourly Moving Average (HMA) and the 10-DMA, close to $1,917.
It’s worth noting that Fibonacci 38.2% on one-day and previous weekly top offers immediate support to the Gold price near $1,940. Additionally, a joint of the 5-DMA and 10-SMA on four-hour could test the XAU/USD bears around $1,935.
Meanwhile, previous daily high and four-hour peak probes Gold buyers near $1,950.
However, major attention is given to the $1,963-66 area comprising Pivot Point one-wee R2 and tops marked during late March 2022.
Should the Gold buyers keep the reins past $1,966, the odds of witnessing the $2,000 on the chart can’t be ruled out.
Here is how it looks on the tool
About Technical Confluences Detector
The TCD (Technical Confluences Detector) is a tool to locate and point out those price levels where there is a congestion of indicators, moving averages, Fibonacci levels, Pivot Points, etc. If you are a short-term trader, you will find entry points for counter-trend strategies and hunt a few points at a time. If you are a medium-to-long-term trader, this tool will allow you to know in advance the price levels where a medium-to-long-term trend may stop and rest, where to unwind positions, or where to increase your position size.