- Silver price is looking to position its feet confidently above the breakout region of the Descending Triangle.
- Advancing 20-EMA indicates that the short-term bullish trend is intact.
- A bullish range shift by the RSI (14) will trigger the upside momentum.
Silver price (XAG/USD) has sensed barricades after testing strength near the critical resistance of $24.00 in the Asian session. The white metal has faced pressure as the US Dollar Index (DXY) has displayed signs of recovery after dropping to near 101.30. The USD Index might be supported by the market participants as investors might get anxious ahead of the release of the United States Personal Consumption Expenditure (PCE) Price Index (Dec).
Meanwhile, the market sentiment seems negative as the S&P500 futures are displaying decent losses in the Asian session. The 10-year US Treasury yields have climbed to near 3.51%.
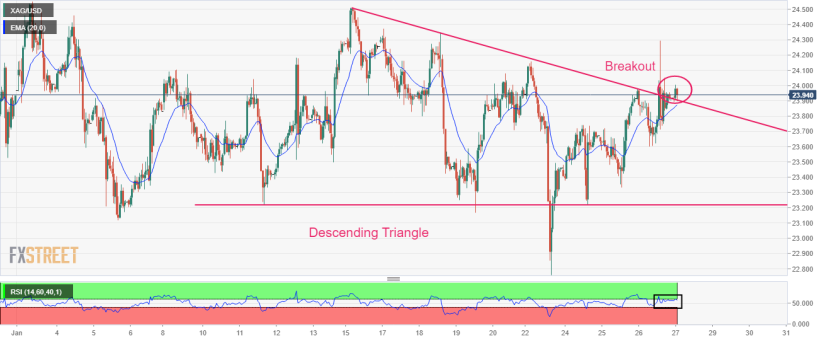
Silver price is employing immense efforts to sustain the breakout of the Descending Triangle chart pattern formed on an hourly scale. The downward-sloping trendline of the chart pattern is plotted from January 16 high at $24.50 while the horizontal support is placed from January 11 low at $23.22.
The 20-period Exponential Moving Average (EMA) at $23.88 is aiming higher, which indicates that the short-term bullish trend is intact. Meanwhile, the Relative Strength Index (RSI) (14) is aiming to shift into the bullish range of 60.00-80.00, which will trigger the upside momentum.
Going forward, a decisive move above January 23 high at $24.16 will drive the asset toward January 16 high at $24.50 followed by the psychological resistance at $25.00
On the flip side, a break below January 24 high at $23.74 will drag the asset toward Wednesday’s low at $23.33. A slippage below the latter will further drag the Silver price toward January 23 low at $22.76.
Silver hourly chart