- GBP/USD pair is expected to print a fresh multi-decade low after dropping below 1.1200.
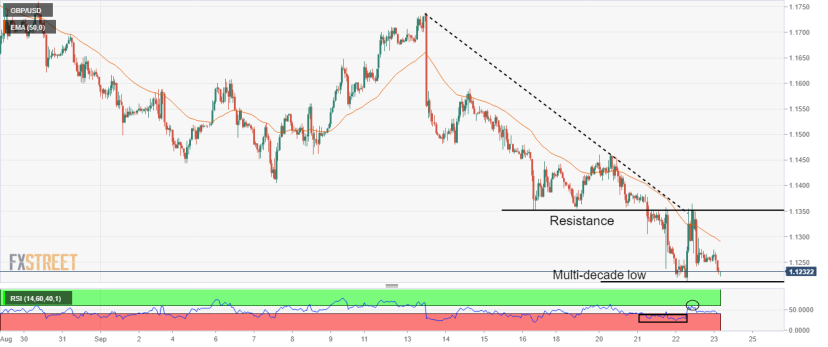
- The downward sloping trendline from 1.1738 has acted as a major barricade for the counter.
- Declining 50-EMA at 1.1290 adds to the downside filters.
The GBP/USD pair has delivered a downside break of the consolidation formed in a narrow range of 1.1250-1.1275 in the Tokyo session. The asset is declining after facing hurdles around 1.1350 on Thursday. The cable is expected to re-test the fresh multi-decade low at 1.1211 and then the auction structure will decide the fate of the asset.
On an hourly scale, the asset is declining towards 1.1211 after dropping below 1.1250. The horizontal resistance plotted from September 16 low at 1.1351 has acted as a major barricade for the pound bulls. Also, the downward-sloping trendline placed from September 13 high at 1.1738 has been restricting the sterling bulls from turning bullish.
The declining 50-period Exponential Moving Average (EMA) at 1.1290 is hinting at more weakness.
A scrutiny of the Relative Strength Index (RSI) (14) displays that the momentum oscillator found resistance around 60.00 and is now on the verge of shifting into the bearish range of 20.00-40.00. An occurrence of the same will weaken the pound bulls further.
After surrendering the fresh multi-decade low at 1.1211, the cable will decline towards the 4 February 1985 high at 1.1160, followed by the round-level support at 1.1100.
Alternatively, pound bulls could regain strength and drive the cable towards Tuesday’s high at 1.1461 and the psychological resistance at 1.1500, if the asset manages to break above Thursday’s high at 1.1363.
GBP/USD hourly chart