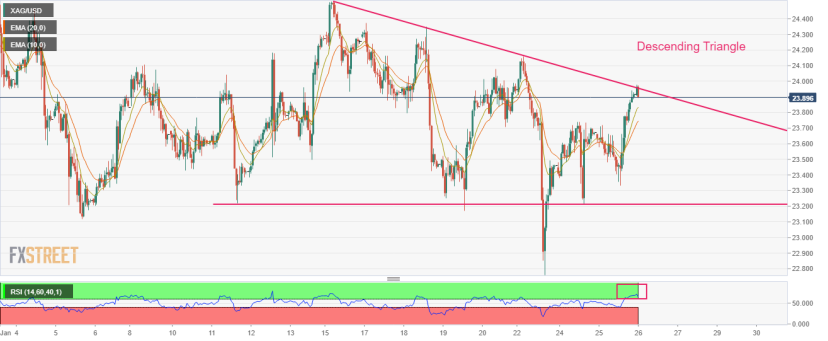
- Silver price is struggling to extend gains further, however, the upside looks likely.
- The asset is on the edge of delivering a breakout of the Descending Triangle chart pattern.
- Early gains in the S&P500 futures indicate that the risk profile is positive.
Silver price (XAG/USD) has witnessed a minor correction in its journey toward the round-level resistance of 24.00 in the Asian session. The white metal has broadly displayed a perpendicular upside move, therefore, the corrective move could be healthy for the Silver bulls.
The US Dollar Index (DXY) witnessed a sell-off on Wednesday after facing barricades around 102.00 and dropped to near a seven-month low at 101.10 as an appeal for the safe-haven assets squeezed ahead of the release of the United States Gross Domestic Product (GDP) data. Investors’ risk appetite is improving further as S&P500 futures are showing gains in the early Asian session.
Silver price is auctioning near the edge of the downward-sloping trendline of the Descending Triangle chart pattern on an hourly scale. The downward-sloping trendline of the chart pattern is plotted from January 16 high at $24.50 while the horizontal support is placed from January 11 low at $23.22.
Advancing 10-and 20-period Exponential Moving Averages (EMAs) at $23.83 and $23.75 respectively, indicate that the white metal bulls have a lot of strength.
The Relative Strength Index (RSI) (14) is oscillating in the bullish range of 60.00-80.00, which indicates that the bullish momentum is active.
A decisive move above January 20 high at $24.08 will result in a breakout of the Descending Triangle, which will drive the asset towards January 18 high at $24.35 followed by January 16 high at $24.50.
On the flip side, a break below January 24 high at $23.74 will drag the asset toward Wednesday’s low at $23.33. A slippage below the latter will further drag the Silver price toward January 23 low at $22.76.
Silver hourly chart
