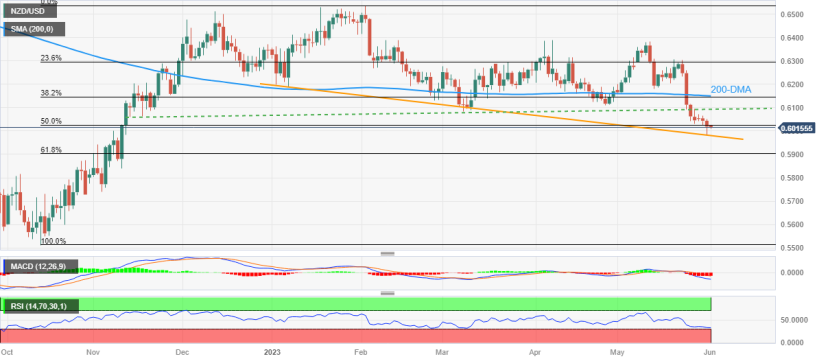
- NZD/USD fades bounce off three-month-old descending support line, stays pressured at the lowest levels since November 2022.
- Oversold RSI backs corrective bounce off the key support but bearish MACD signals turn down recovery hopes.
- Convergence of 200-DMA, 38.2% Fibonacci retracement restricts short-term upside.
- US ADP Employment Change, multiple PMIs eyed for clear directions.
NZD/USD fades bounce off a three-month-old key support line while dropping back to 0.6015 during early Thursday in Asia.
In doing so, the Kiwi pair justifies the bearish MACD signals to extend the previous week’s downside break of the 200-DMA while keeping the bears in the driver’s seat at the lowest levels in seven months. It’s worth noting, however, that the RSI (14) line is almost oversold and hence can offer intermediate bounces during the south-run.
With this, the NZD/USD price may again test the aforementioned support line stretched from March, close to 0.5980 by the press time. However, the quote’s further downside appears elusive.
In a case where the Kiwi pair breaks the stated support line, it can quickly drop to the 61.8% Fibonacci retracement level of October 2022 to February 2023 upside, near 0.5900.
On the other hand, recovery remains unimpressive below an upward-sloping previous support line from mid-November 2022, surrounding 0.6100.
Even so, the NZD/USD pair buyers remain off the table unless witnessing a daily closing beyond a convergence of the 200-DMA and 38.2% Fibonacci retracement, near 0.6150.
NZD/USD: Daily chart
Trend: Limited downside expected
