- Gold price is consolidating in a narrow range ahead of US Employment data.
- Fears of one more interest rate hike from the Fed are expected to improve the appeal for the USD Index.
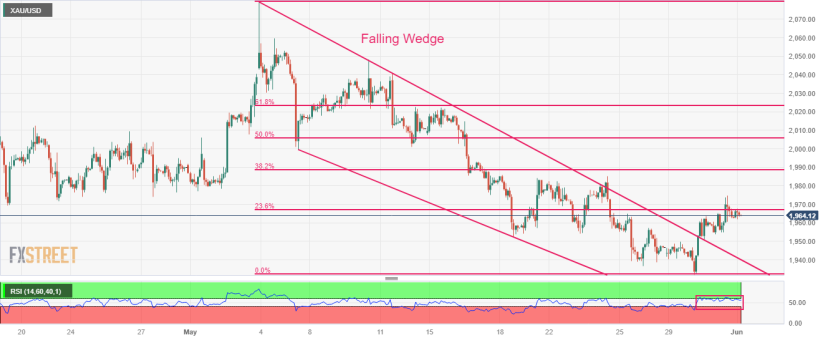
- Gold price is making efforts for breaking above the 23.6% Fibo retracement at $1,967.18.
Gold price (XAU/USD) is demonstrating topsy-turvy moves in a $1,962-1,967 range in the Asian session. The precious metal has turned sideways as investors are awaiting the release of the United States Employment data to gain serious guidance about June’s interest rate policy of the Federal Reserve (Fed).
S&P500 futures are showing choppy moves in Asia after facing selling pressure from investors on Wednesday. The volatility associated with US labor market data weighed on risk-sensitive assets as upbeat numbers would leave no option for the Fed but to raise interest rates further.
The US Dollar Index (DXY) is aiming to extend its recovery above 104.30. Fears of one more interest rate hike from Fed chair Jerome Powell are expected to improve the appeal for the USD Index. After the upbeat US JOLTS Job Openings figure, investors are awaiting US Nonfarm Payrolls (NFP) data to get a clear picture of labor market health.
As per the preliminary report, fresh 190K payrolls were added to the labor market in May, lower than the additions of 253K made in April. The Unemployment Rate is increased to 3.5% vs. the former release of 3.4%. Annual Average Hourly Earnings are seen steady at 4.4% while monthly labor cost is seen expanding by 0.3% at a slower pace than the 0.5% registered in April. This might ease labor cost-push inflation ahead.
Gold technical analysis
Gold price has extended its recovery after delivering a breakout of the Falling Wedge chart pattern formed on a two-hour scale. A breakout of the aforementioned pattern indicates a bullish reversal. The precious metal is making efforts for breaking above the 23.6% Fibonacci retracement (plotted from an all-time high at $2,079.76 to May 30 low at $1,932.12) at $1,967.18.
Also, the Relative Strength Index (RSI) (14) is aiming to shift into the bullish range of 60.00-80.00. An occurrence of the same will activate the upside momentum.
Gold hourly chart