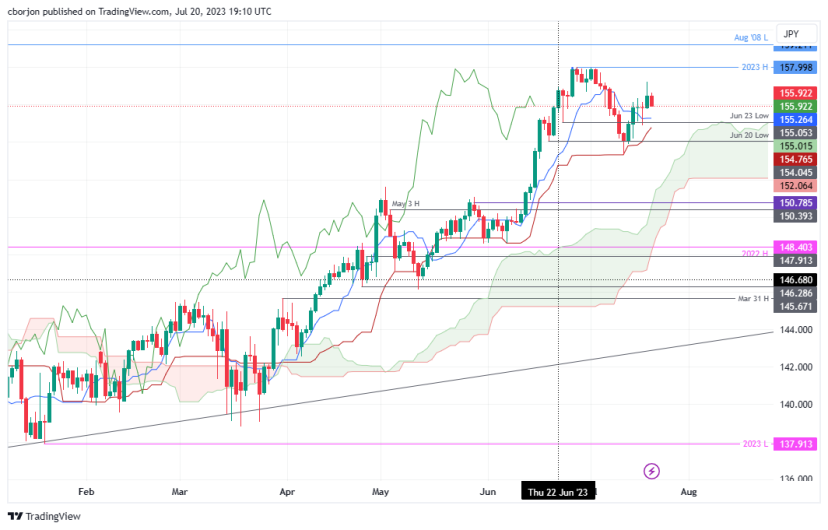
- EUR/JPY registers losses below the 156.00 area due to mixed market sentiment, but the overall uptrend remains.
- The bearish-harami candlestick pattern suggests a potential pullback while maintaining the upward bias.
- EUR/JPY’s key support levels are the Tenkan-Sen line at 155.26, the Senkou Span A at 155.01, and the Kijun-Sen levels at 154.76.
- For buyers to regain control, EUR/JPY must not achieve a daily close below 156.00. Resistance levels lie at the July 19 high of 157.20, and (YTD) high at 157.99.
Late in the North American session, the EUR/JPY registered losses below the 156.00 area amid a mixed market sentiment triggered by upbeat US economic data, underpinning safe-haven currencies in the FX space. At the time of writing, the EUR/JPY exchanges hand at 155.99, after hitting a daily high of 156.62.
EUR/JPY Price Analysis: Technical outlook
The EUR/JPY uptrend remains in play, but today’s price action, coupled with Wednesday, is forming a two-candlestick chart pattern called ‘bearish-harami,’ which suggests the EUR/JPY could be ready for a pullback while maintaining its upward bias.
It should be said that on the EUR/JPY way down, the Tenkan-Sen would be the first support at 155.26. A breach of the latter will expose the Senkou Span A at 155.01, followed by the Kijun-Sen levels emerging at 154.76.
On the flip side, for EUR/JPY buyers to regain control, they must keep prices from achieving a daily close below 156.00. Once done, buyers could remain hopeful for higher prices, with the first resistance being the July 19 high at 157.20, followed by the year-to-date (YTD) high at 157.99.
EUR/JPY Price Action – Daily chart
