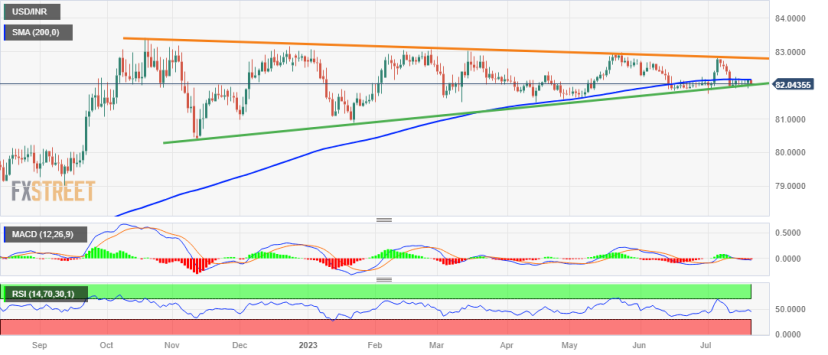
- USD/INR meets with a fresh supply near the 200-day SMA barrier on Friday.
- The technical setup favours bears and supports prospects for further losses.
- A move beyond the symmetrical triangle is needed to negate the negative bias.
The USD/INR pair struggles to capitalize on the overnight bounce from the 81.90 area, or over a two-week low and attracts fresh selling near a technically significant 200-day Simple Moving Average (SMA) on Friday. Spot prices slide back closer to the 82.00 mark during the Asian session and currently trade near the lower end of a familiar range held over the past week or so.
From a technical perspective, the recent repeated failures near the very important 200-day SMA favour bearish traders and support prospects for some meaningful downside. Moreover, oscillators on the daily chart have again started gaining negative traction and
suggest that the path of least resistance for the USD/INR pair is to the downside. That said, it will still be prudent to wait for a sustained breakdown through the lower end of a symmetrical triangle, extending from October 2022, before positioning for any further losses.
Some follow-through selling below the monthly low, around the 81.75 region, will reaffirm the bearish outlook and drag the USD/INR pair towards the next relevant support near the 81.50 zone. Spot prices could eventually drop to test sub-81.00 levels or the YTD low touched in January.
On the flip side, the 82.15-82.20 area, or the 200-day SMA, might continue to act as an immediate strong barrier. A sustained move beyond has the potential to lift the USD/INR pair back to the triangle resistance, currently around the 82.80 area, above which bulls could make a fresh attempt to conquer the 83.00 round figure. The said handle has been acting as a strong barrier since the beginning of this year.
Hence, a convincing breakthrough will be seen as a fresh trigger for bullish traders and set the stage for an extension of the USD/INR pair's well-established uptrend witnessed since August 2022. Spot prices might then surpass the all-time peak, around the 83.40-83.45 region touched in October 2022, and aim to reclaim the 84.00 mark.
USD/INR daily chart
Key levels to watch