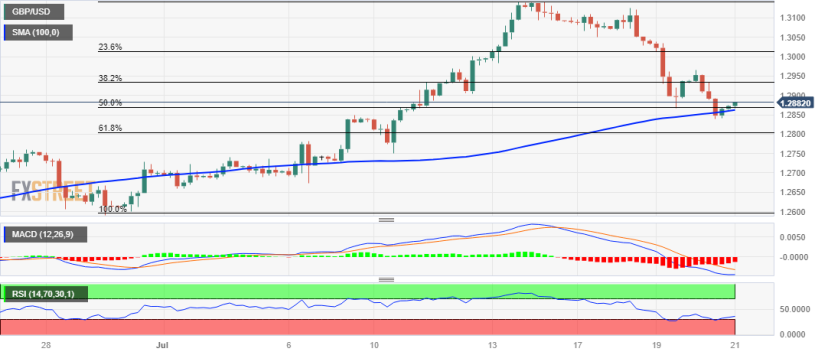
- GBP/USD ticks higher on Friday and recovers a part of the overnight slide to a one-week low.
- Any subsequent move up is more likely to confront stiff resistance near the 1.2930-35 region.
- Bears might need to wait for a sustained break below the 100-period SMA on the 4-hour chart.
The GBP/USD pair edges higher during the Asian session on Friday and moves away from a one-and-half-week low, around the 1.2840-1.2835 region touched the previous day. Spot prices, however, lack any follow-through buying or bullish conviction and currently trade near the 1.2880 region, up just over 0.10% for the day.
The US Dollar (USD) is seen consolidating the overnight strong move up to over a one-week high and turning out to be a key factor lending some support to the GBP/USD pair. The downside for the USD, however, seems limited in the wake of the upbeat US macro data released on Thursday, which continues to flash strength in the US labour market and supports prospects for further policy tightening by the Federal Reserve (Fed). Furthermore, investors remain sceptic about whether the Fed will commit to a more dovish policy stance or stick to its forecast for a 50 bps rate hike by the end of this year.
Hence, the focus will remain glued to the highly-anticipated FOMC policy decision, scheduled to be announced next Wednesday. In the meantime, a softer risk tone could further lend support to the safe-haven Greenback. The British Pound (GBP), on the other hand, might continue with its relative underperformance on the back of softer UK consumer inflation figures released this week, which ease pressure on the Bank of England (BoE) to hike interest rates more aggressively. This, in turn, might hold back traders from positioning for any meaningful appreciating move for the GBP/USD pair.
From a technical perspective, spot prices show some resilience below the 100-period Simple Moving Average (SMA) on the 4-hour chart and manage to move back above the 50% Fibonacci retracement level of the June-July rally. The GBP/USD pair, for now, seems to have stalled the recent pullback from the highest level since April 2022, around the 1.3140 area touched last week. Any subsequent move up, however, is likely to find stiff resistance near the 1.2900 round-figure mark and runs the risk of fizzling out rather quickly near the 38.2% Fibo. level, around the 1.2930-1.2935 region.
Given that oscillators on the daily chart are still holding in the positive territory, a sustained strength beyond the latter will suggest that the corrective decline has run its course and pave the way for additional gains. The GBP/USD pair might then accelerate the momentum towards reclaiming the 1.3000 psychological mark, which coincides with the 23.6% Fibo. level and should act as a pivotal point. Hence, some follow-through buying will shift the near-term bias back in favour of bullish traders.
On the flip side, the 100-period SMA on the 4-hour chart, currently pegged around the 1.2855-1.2850 region, now seems to protect the immediate downside. A convincing break below might expose the 61.8% Fibo. level, around the 1.2800 mark, below which the GBP/USD pair could accelerate the fall towards the next relevant support near the 1.2750-1.2745 zone en route to the 1.2700 round figure and the 1.2685-1.2680 region.
GBP/USD 4-hour chart
Key levels to watch
