- Canadian Dollar declines versus the US Dollar on Friday after Canadian Retail Sales come out lower than expected in May.
- The USD also benefits from JPY outflows ahead of the BoJ meeting next week.
- The Greenback is supported by strong Initial Jobless Claims data on Thursday, which showed a sharp fall in new unemployment claimants.
- Technically the pair is trading in a range above a thick band of support in the upper 1.30s.
The Canadian Dollar (CAD) edges down against the US Dollar (USD) on Friday, after official data shows Canadian shoppers tightened their belts in May.
The US Dollar also benefits from outflows from the Japanese Yen as traders shed their JPY holdings in favor of the Buck ahead of the Bank of Japan policy meeting next week, at which the board of governors is seen as likely to maintain the current ultra-loose policy.
The USD/CAD pair trades in the 1.31s as the US session gets underway.
Canadian Dollar news and market movers
- The Canadian Dollar loses ground against the US Dollar after the release of Canadian Retail Sales on Friday, which comes out lower-than-expected, printing 0.2% in May versus the 0.5% forecast from 1.0% in the previous month of April.
- Retail Sales ex Autos also falls below expectations, printing a 0.0% change in May versus the 0.3% expected and the 1.2% rise registered in April.
- Canadian New Housing Price Index data, released at the same time, registers a 0.1% rise in June, which was higher than the 0.0% forecast but the same as the 0.1% previous.
- The lower-than-expected Retail Sales data weighs on the CAD (USD/CAD rises) because it indicates consumer spending is falling which will probably lead to lower inflation and lower interest rates – a negative for the Canadian Dollar.
- The Greenback benefits from outflows from the Japanese Yen (JPY), according to a report by Reuters, cited by FXStreet Lead Analyst, Eren Sengezer. Traders are dropping the Yen ahead of next week’s Bank of Japan (BoJ) policy meeting amidst expectations the BoJ will maintain its Yield Curve Control (YCC) at current levels when some tightening had been expected previously amid higher inflation.
- The US Dollar is further supported by lower-than-forecast US Initial Jobless Claims data for the week ending July 14. First-time applications for unemployment benefits in the US declined to 228,000, the Department of Labor announced on Thursday. This was well below the market expectation of 242,000. The strong jobs data suggests more persistent inflationary pressures ahead, which should keep interest rates higher for longer – a positive for the Buck.
Canadian Dollar Technical Analysis: Treading water near critical support level
USD/CAD is probably in a long-term uptrend on the weekly chart, which began at the 2021 lows. Since October 2022, the exchange rate has been in a sideways consolidation within that uptrend. Given the old saying that ‘the trend is your friend’, however, the probabilities favor an eventual continuation higher and longs over shorts.
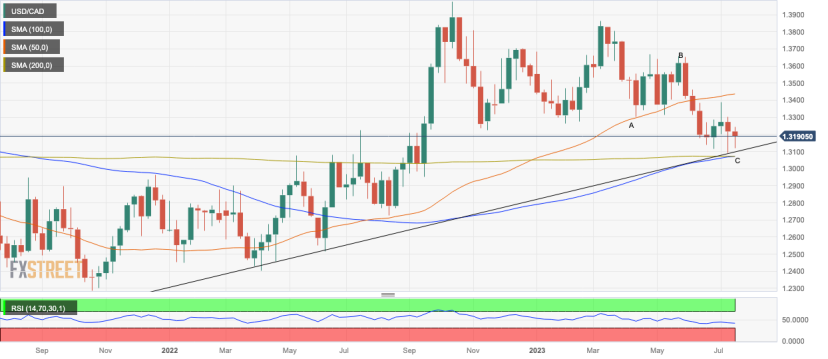
USD/CAD appears to have completed a large measured move price pattern that began forming at the March highs. This pattern resembles a 3-wave ABC correction, in which the first and third waves are of a similar length (labeled waves A and C on the chart below).
US Dollar vs Canadian Dollar: Weekly Chart
A confluence of support situated in the upper 1.3000s, which is made up of several longer moving averages and a major trendline, prevented last week’s decline from extending any lower and provided a foundation for the reversal on Friday and Monday.
US Dollar vs Canadian Dollar: Daily Chart
The long green up-bar that formed on Friday is a bullish engulfing Japanese candlestick reversal pattern. When combined with the long red down bar that formed immediately before it, the two together also complete a two-bar bullish reversal pattern.
The Relative Strength Index (RSI) is converging bullishly with price at the July lows when compared to the June 27 lows. At the June 27 lows, RSI was lower than in July despite price being higher. This suggests underlying strength and is a bullish sign.
Monday’s weak close, however, failed to provide confirmation for the reversal, and since then, the price has been pulling back down.
It will take a decisive break above the 50-day Simple Moving Average (SMA) at circa 1.3400 to refresh and reconfirm the USD/CAD long-term uptrend. Nevertheless, bulls marginally have the upper hand, with the odds slightly favoring a recovery and a continuation higher.
Alternatively, a decisive break below 1.3050 would indicate the thick band of weighty support in the upper 1.30s has been definitively broken, bringing the uptrend into doubt.