- EUR/JPY pared most of Friday’s gains, falling towards the 156.40 area (20-day SMA).
- European surveys came in lower than expected, while Japan reports solid figures.
During Monday’s session, the EUR/JPY pair traded lower following weak Eurozone PMI data, and German yields decreased ahead of Thursday’s European Central Bank (ECB) decision. On the other hand, Japan reported resilience which made the JPY gain traction.
The Services PMI released by the S&P Global and Hamburg Commercial Bank (HCOB) saw weakness in the primary Eurozone’s Manufacturing and Service sector as they all came in below expectations in July. The French and German Services PMI fell to 52 and 47.4, while the Manufacturing Index dropped to 44.5 and 38.8, respectively, failing to meet expectations. That said, the Eurozone’s PMI plunged to 42.7 while the Services index fell to 51.1, also lower than expected.
Ahead of Thursday’s meeting, the European Central Bank (ECB) tightening expectations have fallen. A 25 basis point hike is largely priced in this week, but according to the World Interest Rate (WIRP) tool, the odds of similar hikes in September, October and December fell to 55%, 70% and 75%, respectively. As a result, German yields continued to decrease. The 2-year yield fell to 3.18% while the 5 and 10-year rates dropped to 2.51% and 2.36%, respectively, with all three seeing more than 2% decreases on the day, making the EUR struggling to find demand in FXs markets.
On the other hand, Japanese PMIs from July showed that the economy is holding resilient in contrast to the economic downturn seen in the region. The Jibun Bank Services PMI released by Markit Economics remained steady at 52.1, while the Manufacturing Index fell slightly to 49.4. Regarding the Bank of Japan’s (BoJ) decision on Friday, markets expect to steady its dovish policy and raise its FY23 core inflation forecast to 2.5%. According to several analysts, the Yield Control Curve (YCC) policy will likely come under scrutiny in October with liftoff to be seen in 2024.
EUR/JPY levels to watch
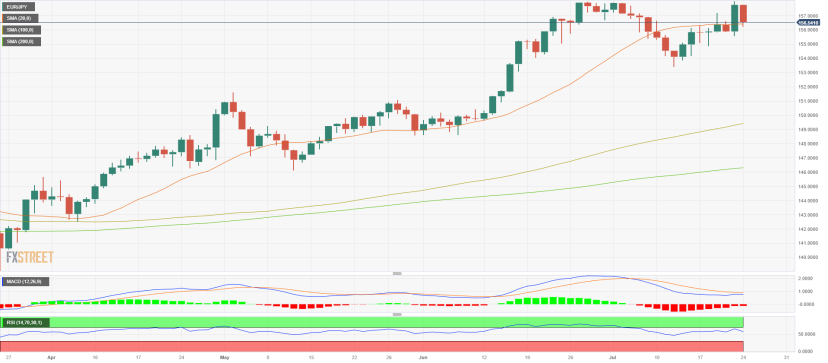
The daily chart analysis indicates a neutral to a bearish outlook in the short term. The Relative Strength Index (RSI) trades in positive territory, but its steep negative slope suggests weakening bullish strength and a potential bearish reversal. The Moving Average Convergence Divergence (MACD) histogram shows red bars, signalling a downward trend, but their gradual fading suggests diminishing bearish pressure. This may open up possibilities for short-term consolidation or a minor bullish retracement.
Resistance levels: 157.00, 157.50, 158.00.
Support level: 156.40 (20-day SMA), 156.00, 155.50.
EUR/JPY Daily chart