- GBP/JPY trades below 182.00 on Monday, seeing more than 0.40% losses.
- UK PMI surveys fueled dovish bets on the BoE amid worries about the British economy’s health.
- Japan reported solid PMIs; still, markets bet on a dovish BoJ.
Starting the week, the GBPJPY pair is trading lower near 181.35, though it has maintained relatively stable levels since mid-June. On the one hand, Japan reported solid PMIs in July, while the British ones came in weak sparkling dovish bets on the Bank of England, which decreased local yields, applying selling pressure on the GBP.
The British PMI monthly Composite Reports from July on Manufacturing and Services, released by S&P Global, all came lower than expected and sparked worries about the UK’s economic health. The manufacturing index slid to 45, while the Services and Global Composite fell to 52.4 and 51.5. As a reaction, the Bank of England’s (BoE) tightening expectations have fallen, with the odds of a 50 basis point (bps) decreasing to around 35% according to the World Interest Rate (WIRP) tool. Looking forward, 25 bps hikes are priced in for September and November, but the odds of a final hike in February 2024 slid to 35%.
Due to dovish bets on the BoE, British yields are falling. The 2-year yield fell nearly 1% to 4.88% while the 5 and 10-year rates to 4.31% and 4.22%, respectively, with similar declines of nearly 1%.
On the other hand, the Jibun Bank Services PMI released by Markit Economics remained steady at 52.1, while the Manufacturing Index fell slightly to 49.4. That said, markets are getting mixed signals ahead of Friday’s Bank of Japan (BoJ) decision. Governor Kazuo Ueda stated that a dovish interest rate policy should be maintained, while Japan’s top currency diplomat, Masato Kanda, stated that inflation surpassing expectations should make the bank consider a policy pivot. Still, the consensus is that the BoJ will steady its dovish stance.
GBP/JPY levels to watch
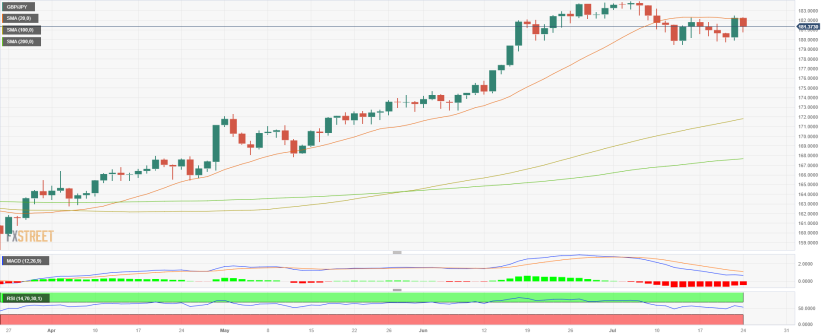
The daily chart shows strong bearish momentum for the short term. The RSI (Relative Strength Index) is in positive territory, with a sharp negative slope approaching the midline. Meanwhile, the MACD (Moving Average Convergence Divergence) prints soft red bars.
Resistance levels: 182.05 (20-day Simple Moving Average), 183.00, 184.00.
Support levels: 180.00. 179.50, 179.00.
GBP/JPY daily chart