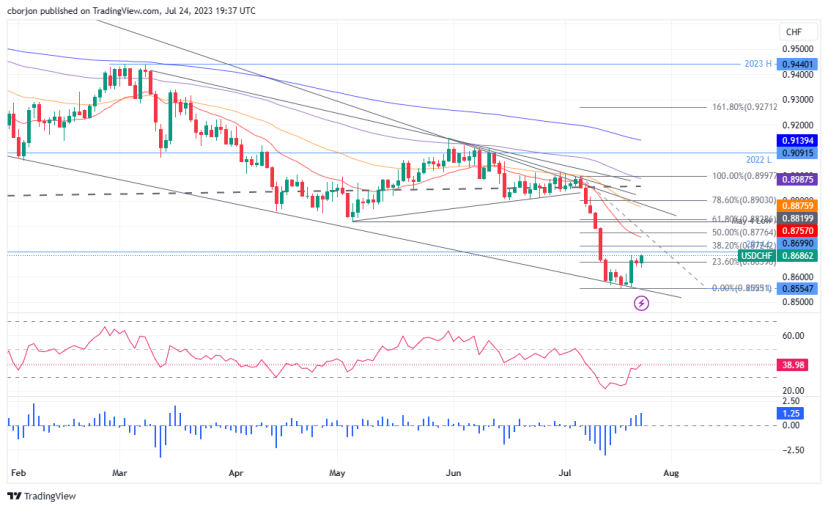
- The USD/CHF could shift to a neutral bias if it reclaims the May 4 daily low of 0.8819, which converges with the 61.8% Fibonacci (Fibo) retracement level.
- Resistance beyond this point lies at the confluence of the 50-day EMA and the 78.6% Fibo level at 0.8875/0.8900, followed by the 0.9000 mark.
- USD/CHF's path of least resistance remains downward, with the 23.6% Fibo retracement at 0.8659 marking the level to beat for sellers.
USD/CHF rebounds from last Friday's lows of 0.8640 and climbs on a strong US Dollar (USD) amid a risk-on impulse as Wall Street prints solid gains. The USD/CHF is trading at 0.8683, gains 0.31%, after hitting low of 0.8637.
USD/CHF Price Analysis: Technical outlook
The USD/CHF is yet to turn neutral, even though it recovered some ground during the last three trading days, with the pair gaining 1.50%. Should be said, the USD/CHF could shift its bias to neutral if it reclaims the May 4 daily low of 0.8819, confluence with the 61.8% Fibonacci (Fibo) retracement.
If that ceiling level is broken, the next resistance would emerge at the next confluence of the 50-day EMA and the 78.6% Fibo level at 0.8875/0.8900 area, followed by the 0.9000 mark.
Nevertheless, the USD/CHF path of least resistance is downwards and will resume its downtrend once sellers drag prices below the 23.6% Fibo retracement at 0.8659. On further weakness, the USD/CHF could extend its losses past the 0.8600 figure, followed by the year-to-date (YTD) Low of 0.8554.
From an oscillator standpoint, the Relative Strength Index (RSI), aiming upwards, suggests the USD/CHF upward correction could continue, but as it remains in bearish territory, once turning flat, could pave the way for a reversal. Contrarily, the three-day Rate of Change (RoC) portrays buyers entering the market. That said, mixed signals could refrain USD/CHF traders from opening fresh positions ahead of the FOMC’s meeting.
USD/CHF Price Action – Daily chart